Motion data are a rich source of information, but in their raw form they are represented by long vectors of float numbers, which are completely uninteligible to humans. This is typically solved by displaying the source video recordings, when available, or creating animations of the skeleton data. However, viewing the videos or animations is time-consuming and therefore not suitable for situations where users desire to quickly grasp the content of multiple motion sequences, e.g., when browsing or querying collections of motion data.
The MocapViz library, on the other hand, allows to visualize motion sequences by static images that can be read at a glance, and provides functionality for visual comparison of two motion sequences and exploration of large collections of motion data. The library was utilized to create public web interfaces for the exploration of two popular motion datasets:
The MocapViz library is freely available and can be downloaded here.
Visualization of individual motion sequences
In MocapViz, individual short motions can be vizualized by a static image containing the timeline of the most significant poses. A few poses preceding each keypose are also drawn with a low opacity, which provides a better feeling of the movement. For each motion, a static camera position is chosen so that maximum information is shown; the camera is typically placed orthogonally to the motion direction. To make the poses easier to read, we use different colors for left/right body parts, and add artificial “nose” line that expresses the direction where the skeleton is looking. Furthermore, we also provide a bird-eye view of the motion in space, to allow better understanding of the spatial dimension that is lost in the 2D image.
Visualization of differences between two motion sequences
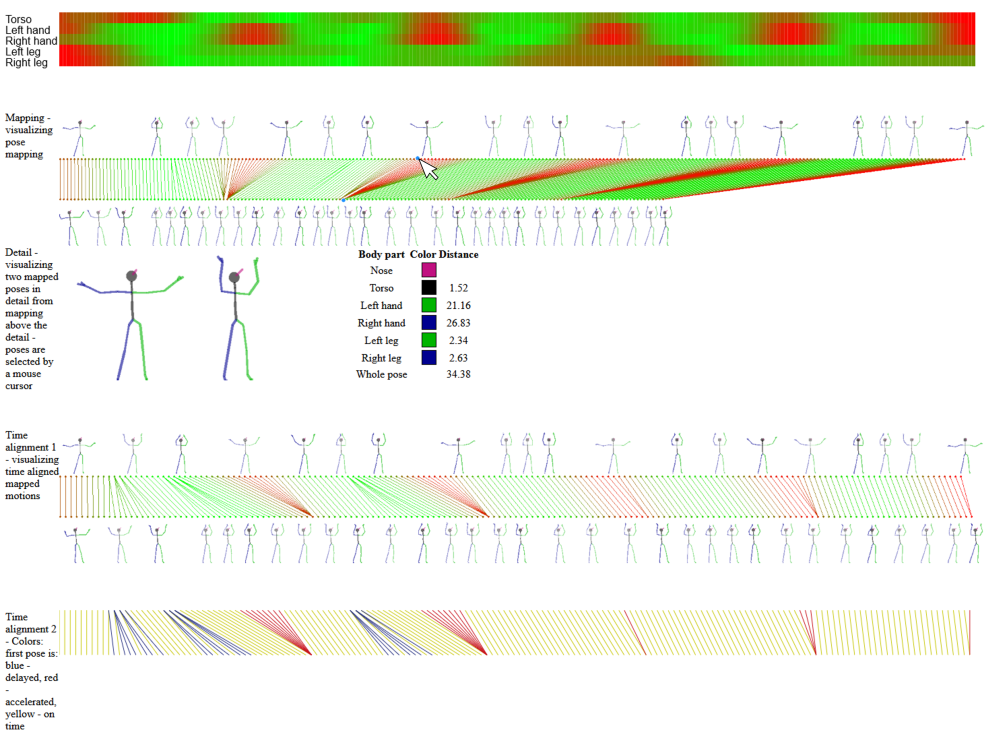
MocapViz also allows to visualize the differences between two motion sequences, as detected by a sequence alignment algorithm. We have designed several new visualizations that focus on different aspects of the motion data.
- Overall similarity of motion sequences: To visualize the complete pose-to-pose mapping of the compared sequences, we first represent each motion by the motion image presented earlier. To be able to draw the mapping among all poses and not just the key-poses depicted in the motion image, we add a time-line of dots representing all the poses. The dots are connected by lines that express the optimal pose-to-pose mapping, colored on the red-green scale to express the closeness of individual mapped poses.Depending on user settings, the closeness of pose matching can be evaluated in the context of the specific two actions (thus highlighting even small differences in two similar motions) or in the context of the whole dataset (to better distinguish between minor and major differences).
- Differences of matched poses in individual body parts: Some pairs of motions may only differ e.g. in the movement of hands, while the legs are static or move in the same way. To highlight such situations, we visualize the closeness of pose mapping for individual body parts.
- Detailed view on the matched poses: For any two mapped poses, it is possible to view the detailed drawing of the poses and the computed differences between individual body parts. The detail is accessed by pointing the mouse on the desired pose in one of the sequences.
- Visualization of time alignment: In this view, we detect and visualize the changes of speed in the compared motions. First, both the compared sequences are normalized to the same length (by resampling the longer one). Next, the optimum mapping between the two normalized sequences is found, and the positions of speed-ups and slow-downs are marked.
Exploration of motion datasets
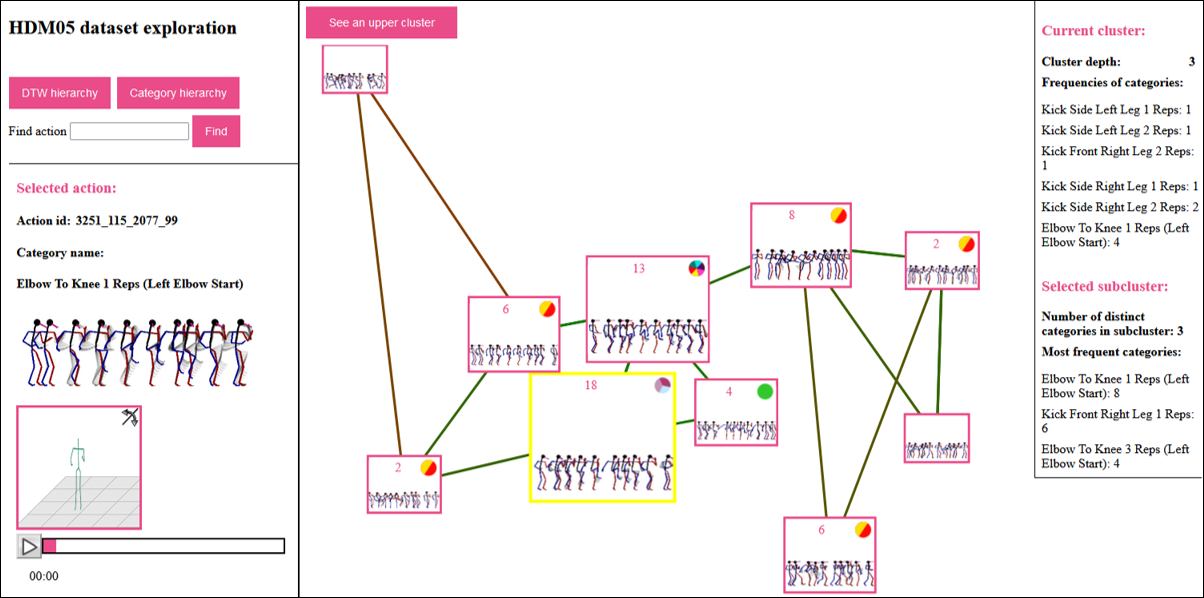
The objective of data exploration is to reveal the content of a whole dataset, often totally unknown to the users who want to work with the data. For this purpose, we have prepared an interactive exploration interface that reveals the hierarchical structure of the dataset and the similarity relationships between individual objects. Motion datasets typically contain sequences sorted into semantic categories that determine the type of the motion (jump, run, etc.). For people who want to familiarize themselves with the dataset, it is also very relevant to see to what extent the semantic categories agree with the natural clustering of data as provided by the content-based distance measures (e.g., the DTW algorithm). Therefore, the exploration interface allows browsing by both semantic categories and purely content-based clusters, and provides information about the semantic diversity of the content-based clusters.
MocapViz user guide
The three main functionalities provided by the MocapViz library can be accessed as follows:
- Visualization of individual motion sequences: To obtain this visualization, it is first necessary to create a factory object and set the data model for the sequences to be visualized:
const factory = new Mocap.VisualizationFactory();
factory.model = Model.modelVicon;
Currently, two models are available within the library: modelVicon with 31 joints, and modelKinect with 25 joints. Additional models can be created in model.js.
The visualization is produced by calling the following function:
factory.createVisualization(sequence, visualizationWidth, visualizationHeight,
mapWidth, mapHeight)sequence sequence to be visualized provided as a list of poses; each pose is a coma-separated sequence of 3D joint coordinates visualizationWidth, visualizationHeight the desired width and height of visualization mapWidth, mapHeight the desired width and height of the map depicting movement in space - Visualization of differences between two motion sequences: This visualization is provided by the function
factory.visualizeSequenceDifferences(sequence1, sequence2, visualizationWidth = 1500, contextOption = ContextOption.NO_CONTEXT, defaultContext = "", visualizationParts = new VisualizationParts())contextOption determines the context of red-green coloring of differences between poses; possible values are ContextOption.NO_CONTEXT (coloring is relative to pose differences within the two compared sequences) and ContextOption.SAMPLED_CONTEXT (coloring is relative to dataset statistics provided in defaultContext) defaultContext only set when context-dependent coloring is required; the context has to be defined as a JSON data object with a structure defined in the documentation visualizationParts the VisualizationParts object determines which views shall be displayed; VisualizationParts(description = true, maps = true, bodyParts = true, sequenceDifference = true, poseDetail = true, timeAlignedSequenceDifference = true, timeAlignedMapping = true); - Exploration of motion datasets: The whole exploration interface is created using files exploration.html and exploration.js. In exploration.js, users set the target data and the precomputed files of dataset hierarchies. The hierarchies can be precomputed using the provided Java program or arbitrary user’s program producing the JSON file in the required structure. Furthermore, the exploration interface uses precomputed images of individual motion objects to avoid costly computations during browsing. The code for precomputing images is also available.


